Tune In

Sonification of India’s intoxication
trends over the last 3 decades.
Data Visualisation
2025

The Dataset is sourced from kaggle
The Dataset is cleaned removing all uneccessary fields.
Integrating Dataset with sound synthesization software
Assigining specific instrument to all 3 factors.
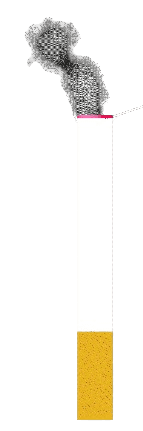
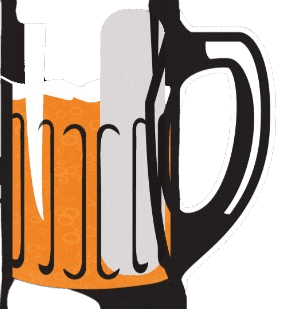
Alcohol - Electric guitar
Smoking- Violin
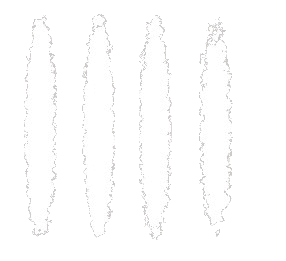
Drugs - PianoAssigining specific values of tempo, volume, octave and
key to create a distinguishing sound of each instrument in
the final composition.
The change in mortality numbers is represented by the
change in “pitch” or intensity of that particular instrument
at a particular time.
Process
For visual experience
Thanks for watching !
Play the video for Audio visual experience
The increase in mortality numbers is represented by -
-Reduction in Cigarette length
-Beer consumption
-Drug lines dissappearing
Analyzing the Increasing mortality
trends of Indian Citizens due to 3 most
eminent categories of Intoxication ( Alcohol
Consumption, Active smoking and Drug Abuse)
from 1990-2020 in the form of visuals and sounds
in a linear timeline to overview it’s Cynical impact.
Concept